WRITTEN BY QuINN BOOTH
Measuring and developing a catcher's performance using Trackman Data.
Catcher defense has always been my favorite part of baseball analytics, and so I knew right away that I was going to work on a catcher project with the Harbor Hawks. It ended up being my proudest work of the summer, and I hope to consistently use and improve the project into the future. I’ll start with my initial goals before explaining each component of the report and how they were used. I’ll also create a post soon that details the best catchers on the Cape this season by my metrics. Feel free to comment here or on Twitter if you want to see the report from a specific Cape League catcher!
Goals
The reports need to…
Have a single game option in addition to season-long, in order to continually grade and improve our catchers
Have a comparison feature to give context for the numbers
Be understandable and applicable for stats nerds, catchers and coaches alike
Be neat and visually pleasing, easily comprehensible
Be multifaceted, giving insight to framing, blocking and control of the running game
Be repeatable, so that I can easily and automatically generate new reports every day
Be available in PDF form for easy distribution and use
Strike Zone Scatterplot
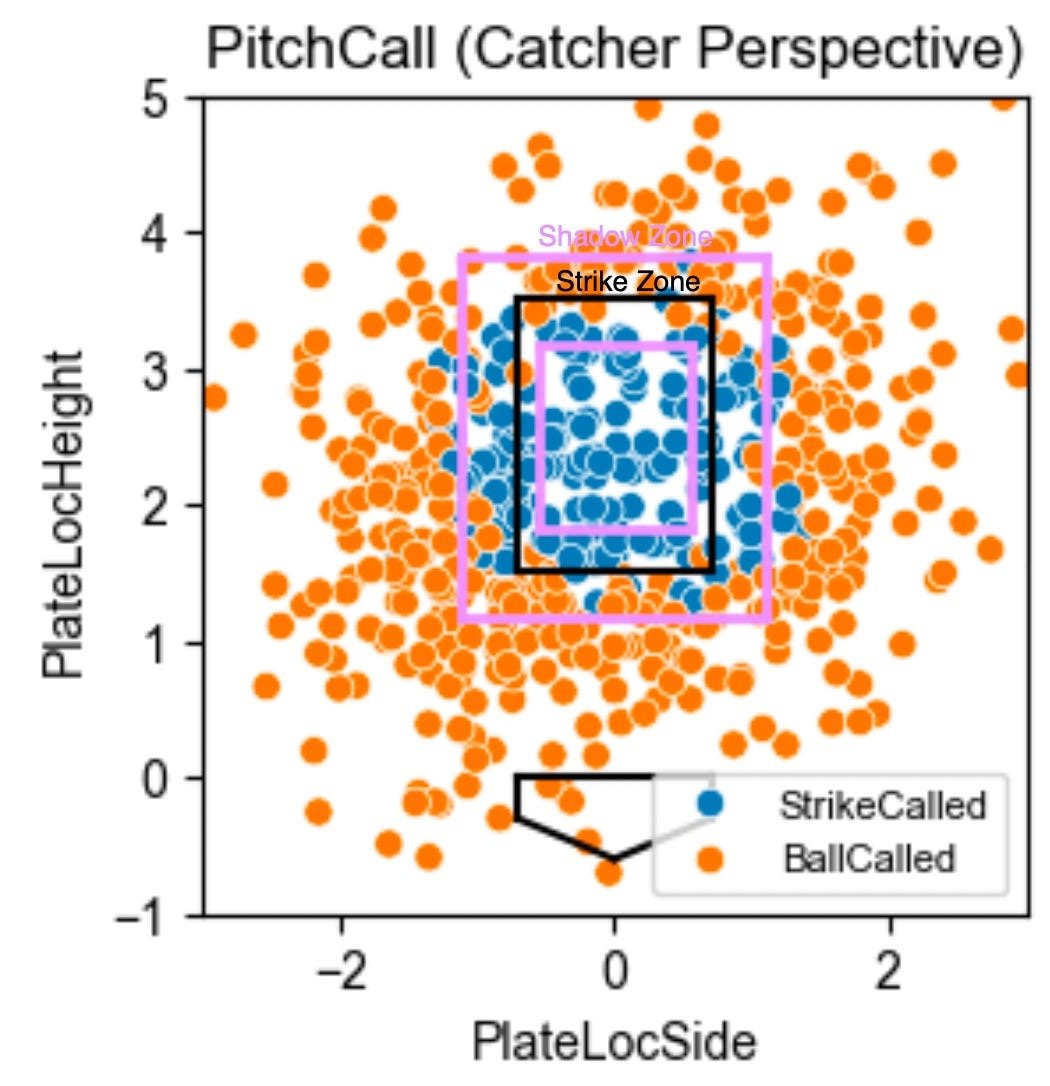
The first step for the report was a fairly simple scatterplot of the Strike Zone with every single called pitch from the chosen game or season. For a single game, you can look at what happened on each individual pitch. With a small sample size, though, each pitch or game could be a fluke, with the umpire heavily swaying the results. I recommended we almost always use the season-long feature, where you can start to see densely colored areas where the catcher is excelling or struggling. I also displayed a “Shadow Zone” which is the area within about a ball of the strike zone, both in and out. This scatter chart was immediately understandable to any coach or player, so I decided to keep it as the centerpiece of my report.
Strike Probability Model
With that simple scatterplot, though, I recognized that the report needed more context and nuance. If you only saw that one plot above, you might think that catcher was elite at stealing strikes off the plate, but that’s not necessarily true. Cape League umpires give about a ball on either side of the zone, consistently calling wide strikes. I approached this problem with a strike probability model, which lent itself to a Strikes Looking Above Average (SLAA) stat.
After talking with another intern Aidan Beilke, I trained the model using XGBoost with just batter handedness, pitch vertical location and pitch horizontal location as features. With more data I would want to include the umpires as a training variable, but I still achieved close to 90% accuracy. Similar to Outs Above Average, my SLAA stat was the difference between the modeled strike probability and the actual result. Summing this stat for each called pitch gives the game, or season, SLAA. Because this statistic is compared versus the predicted average Cape League catcher, it gives a lot more context than simple balls and strikes called. Additionally, I think it helps that it’s a stat where 0 is exactly average. To give a sense of scale, I also displayed a catcher’s SLAA percentile on the report.
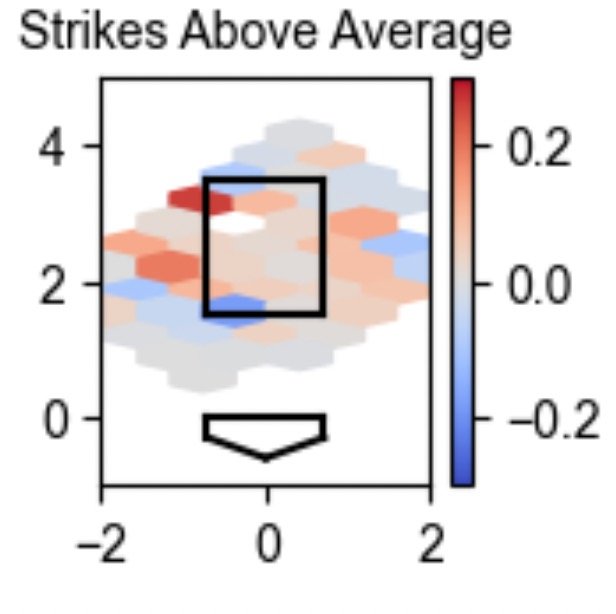
Still, this doesn’t necessarily help a catcher improve. Simply telling them that they’re a good or bad framer likely means nothing. So I converted SLAA into a Strike Zone hexmap to give players a better idea of where they should focus on practicing. Here is the corresponding SLAA graph to the scatterplot and percentiles above.
Pitch type table
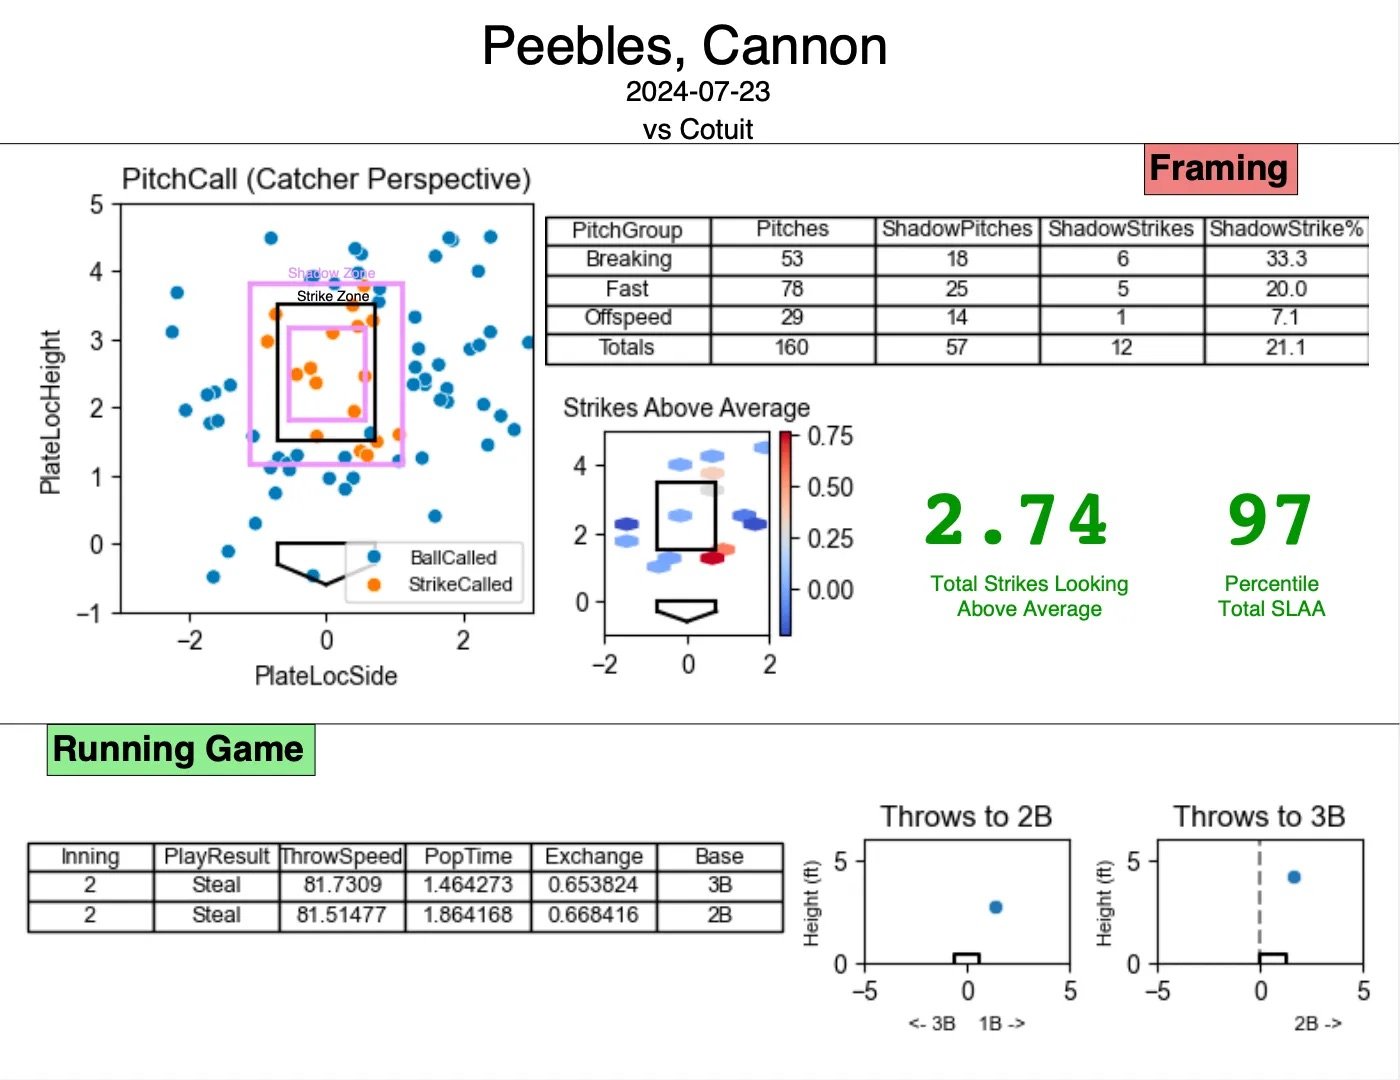
My last framing piece was splitting framing by pitch types. I figured that catchers might have difficulty with different pitches, and so they can look at their technique on those specifically. In the Cape League, I noticed that catchers consistently performed worst on off-speed pitches, at least when it came to the Shadow Zone Strike%. While that could be something for certain players to work on, the fact that it was universal is more a sign that off-speed pitches are harder to frame.
Running Game
Unfortunately, Trackman does not keep data on blocks and passed balls, so I wasn’t able to incorporate that. With a main focus on framing, the only secondary part to the report was the running game. I’m not completely confident in the Trackman pop times, but I thought at the very least the catchers could use exchange time, throw speed and these throw accuracy charts. The season long options creates averages by base for the metrics on the table.
Formatting
Even after all the modeling and visualization was done, the majority of my time on this project was spent on the PDF formatting. Like I said in the goals section, a key part of this project is its ease-of-use. I strongly believe that an unappealing or messy report won’t get used as heavily by the coaches and players. Aidan recommended I use Python package FPDF, which works out well with a lot of trial and error for positioning your elements. I separated my charts and tables by Framing and Running, and emphasized the main two elements: the pitch call scatterplot and the total SLAA number and percentile.
Single Game:
Full Season:
Report Applications
When I completed this project midway through the season, our primary catchers were Jaxson West (Florida State) and Cannon Peebles (Tennessee). Both ended the season with above average framing, and they were devoted to sharpening their craft. At different points, I showed them both their season-long framing reports, explaining what each thing meant and what I thought they would work on. Jaxson, for example, was losing strikes at the bottom of the zone, which held back his plus framing everywhere else. At this point in my career, I’m not comfortable suggesting mechanical tweaks, but in the future I look forward to combining statistical suggestions with physical ones.*
Future of Catcher Reports
For the most part, I’ll be able to easily translate the Catcher Reports over to the NCAA season considering schools use the same Trackman system as the Cape. However, I’ll have to make a decision on how I train the model– with a small 10-team league like the Cape, I felt comfortable assuming the umpires would have a small and consistent rotation. But with over 300 D1 baseball teams and almost 30 conferences, I can no longer make that assumption. The best option might be to give SLAA scores that are trained and compared only to a catcher’s own conference.
Additionally, a long term goal would be to create MLB catcher reports, which I haven’t seen any of in the sports data world. MLB StatCast would open up a new world of blocking metrics, and also allow the extra variable of umpires. Maybe someday there can even be a Twitter bot for these reports.
Thank You’s and Credits
Just like my first project, a big thank you to fellow interns Aidan Beilke, Gabe Appelbaum, Richard Legler and Tyler Warren, as well as my bosses Cole Velis and Mikey Lucario
Another Baseball Ops Intern, Tyler Cosgrove, taught me a ton about the art of catching this summer and shared a lot of his experience.
I used Nick Wan's code on Kaggle to visualize the Strike Zone and Shadow Zone.
TJStats and UmpScorecards (by Ethan Singer and Ethan Schwartz) are both major inspirations for this project, with their pitcher and umpire reports respectively.
All data comes from Trackman Baseball
Thanks for reading, and let me know if there’s a Cape catcher report you want to see!
*And if you have any recommendations on catcher coaching books, articles, or videos, please share them!


